

The Brainstorm Long Read: there are many factors to explain why hundreds of thousands of registered voters do not vote at Irish elections
By Adrian Kavanagh and William Durkan, Maynooth University
Voter turnout can be defined as the percentage of people who turn out to vote in a given election. In the United States, voter turnout levels are calculated as the percentage of the valid adult population who turn out to vote. But in Ireland and other European countries, voter turnout levels are expressed as a percentage of the number of people on the electoral register. Thus, if there are problems with the electoral register, turnouts may be over, or under, estimated in these countries, including Ireland

Rather than skewing or dampening the geography of voter turnout levels in Ireland, register inaccuracies have the effect of actually dampening the extent of turnout differences. Our research was based on a comparison between the numbers on the electoral register for the 2002 general election and population levels at the 2002 Census (see Figure 1).
This showed that registration levels in high turnout areas – mainly rural areas, but also some settled middle class urban areas – tended to be over-estimated. This meant that the "real turnout" levels in these higher turnout areas was actually higher than the recorded turnout levels. By contrast, registration levels in very low turnout areas – mainly inner city areas and commuter belt areas – tended to be under-estimated, meaning that the "real turnout" levels in these low turnout areas were actually even lower than the recorded levels.
We need your consent to load this rte-player contentWe use rte-player to manage extra content that can set cookies on your device and collect data about your activity. Please review their details and accept them to load the content.Manage Preferences
From RTÉ News, RTÉ correspondents report on voter turnout for the 2016 general election
The maps/analyses that feature in this article are based on turnout levels as related to the number of people on the electoral register. Research is always work in progress and subsequent developments of this analysis will involve the calculation/mapping of voter turnout levels as related to the valid adult population, based on an analysis of the Census 2016 population figures.
What influences voter turnout?
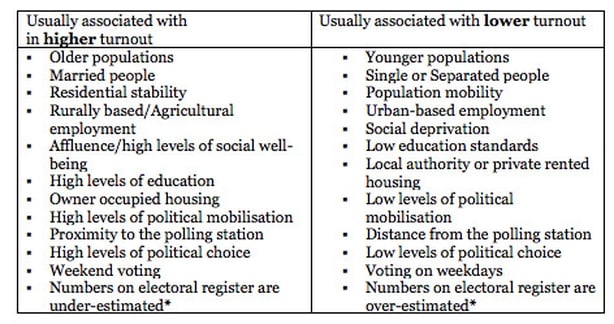
Voter turnout levels are the result of a multiplicity of different turnout decisions made by individual electors. These, in turn, are shaped by a host of sometimes conflicting socio-economic and demographic factors, but also by the places and contexts in which voters live and work. A range of socio-economic, demographic, political and institutional factors help explain why turnouts between areas differ, with some of these listed below (Table 1). Perhaps the most significant factor of all in terms of predicting turnout variation is housing tenure, as this is a factor that relates to nearly all of the other key influences on turnout variation
The under-estimating (or over-estimating) of numbers on the electoral register will result in the recorded turnout levels being higher (lower) than they are in reality. However, past research (Figure 1) shows that registration levels generally tend to be under-estimated in lower turnout areas (meaning that turnouts in those areas are actually lower than their recorded levels) and registration levels generally tend to be over-estimated in higher turnout areas (meaning that turnouts in those areas are actually higher than their recorded levels).
Does turnout vary depending on election?
Turnouts tend to be usually, but not exclusively, highest for general elections, or "first order elections". They tend to be lower for other, "second order", election contests, such as local elections, European elections, referendums and presidential elections.
There is – as always – a "geography" to this. Turnouts tend to be notably higher at general election contests in rural areas, although some rural areas can also register relatively high turnout levels for local election contests – a trend that can be also characteristic of some urban working class areas. Indeed, turnout levels tended to be higher at the 2004 Local Elections in a number of peripheral/marginalised rural and urban working class areas as compared with turnout levels at the 2002 general election.
We need your consent to load this rte-player contentWe use rte-player to manage extra content that can set cookies on your device and collect data about your activity. Please review their details and accept them to load the content.Manage Preferences
From RTÉ Radio One's Drivetime, Fergal Keane reports on Leaders Questions in the Dáil about the electoral register ahead of the referendum on the Eighth Amendment
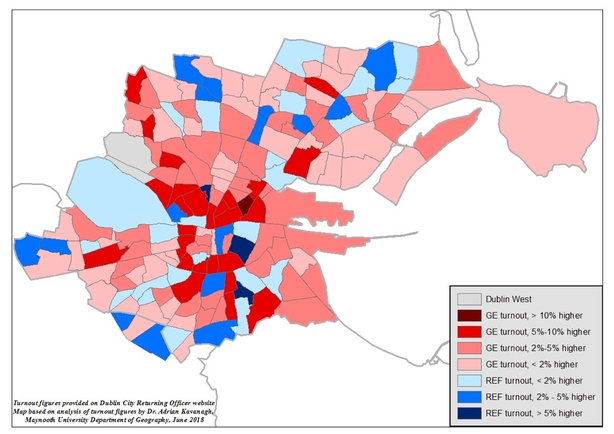
By contrast, voters in middle class urban areas tend to be relatively more interested in participating in referendum contests, as evidenced in the fact that constituencies, such as Dún Laoghaire and Dublin Rathdown tend to have the highest turnout levels nationally for these types of elections. The difference in turnout levels between general election and referenda tends to be much narrower in these areas.
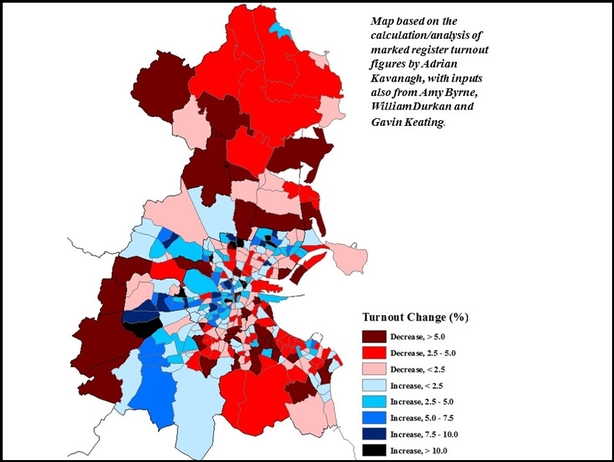
Turnouts for the referendum on repealing the Eighth Amendment in May 2018 were actually higher in some parts of Dublin than the levels recorded in these areas at the 2016 general election (see Figure 2). As well as the high turnouts in middle class Dublin areas, turnouts in the more working class areas were also much higher in May 2018 than those normally recorded for referendum contests in those areas.
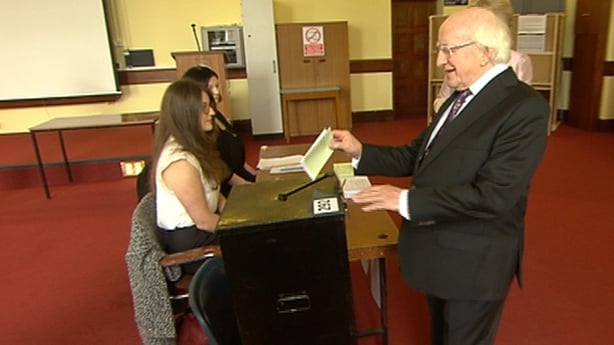
Voting for a new president
Turnouts at Irish presidential elections are lower than general election turnouts. Less importance is usually invested in these by the electorate, fewer campaign resources tend to be invested and smaller numbers of campaign workers are generally involved. Up until the 1990s, turnouts in presidential elections tended to be roughly eight percent lower than those for preceding general elections, as discussed by Trinity College political scientist, Professor Michael Marsh.
However, the turnout rate for the 1997 Presidential Election amounted to a decline of 20 percent on the turnout level for the preceding general election, which also marked a contrast with the relatively high turnout for the 1990 Presidential Election. Marsh accounts for the low 1997 turnout by pointing to the bad weather on Election Day, in addition to the expectation of a comfortable victory for Mary McAleese. The fall in turnout levels between the 2011 general election and 2011 presidential election was significant, but not as dramatic as in 1997, amounting to a decline of just under 14 percent.
We need your consent to load this rte-player contentWe use rte-player to manage extra content that can set cookies on your device and collect data about your activity. Please review their details and accept them to load the content.Manage Preferences
From RTÉ Radio One's Today With Sean O'Rourke, Michael Marsh (Emeritus Professor of Political Science, TCD), Michael Gallagher (Professor Of Comparative Politics, TCD) and Gail McElroy (Professor of Political Science, TCD) discuss the book How Ireland Voted 2016
As with the general and local elections, there were quite defined rural-urban variations in the 1997 Presidential Election turnout rates, albeit not to the same extent as for the other elections. The average turnout level for the Dublin region (43.0%) was somewhat lower than the national average (46.7%), with the lowest turnouts registered in the more working class constituencies of Dublin Central (34.5%), Dublin South West (34.6%) and Dublin North West (39.7%). By contrast, the turnout level in Dublin (56.8%) was actually higher than the level in the rest of Ireland (55.9%) for the 2011 election, although the fact that a Dáil by-election in Dublin West took place on the same day would have influenced the Dublin turnout level.
The turnout geography for the 2011 contest reflected elements of the turnout geographies usually associated with general and local election contests, but also those associated with referendum elections. Constituencies with the highest turnout levels included constituencies that tended to have high local and general election turnout levels – Tipperary North (61.3%), Cork North-West (60.8%) and Roscommon-South Leitrim (60.4%). However, constituencies that tend to have the highest referendum turnouts – Dublin North-Central (64.0%), Dublin South (61.9%) and Dún Laoghaire (60.0%) – also figured amongst the high turnout constituencies at the presidential election in 2011. This same trend was also evident in terms of the low turnout constituencies.
Why are Irish voters not showing up on the day?
Ireland has had one of the lowest average turnout levels in western Europe across recent electoral contests. For instance, only Portugal and Switzerland had lower average turnouts than Ireland did during the 1990s. Low and declining voter turnout levels became increasingly characteristic of Irish electoral contests in the final two decades of the 20th century, with general election turnouts falling by 13.5% between 1981 and 2002. The record low turnout levels for the 2002 contest marked the culmination of this trend.
Subsequent electoral contests, starting with the second Nice Treaty Referendum in 2002, saw a recovery in turnout levels across different electoral contests, with these generally returning to levels experienced before the start of the Celtic Tiger era, although there were still a number of contests with relatively low levels. Turnout levels fell by almost 10 percent in Dublin and its commuter belt between 1992 and 2002, but improved across the following decade and would exceed the 1992 levels at the 2011 general election. With the level of turnout improvement not being as marked in the generally higher turnout rural areas, there was a significant narrowing of the very large turnout differences between rural and urban Ireland that had characterised the low turnout elections of 1999 (local and European elections) and 2002 (general election).
The low turnout in the 1999 and 2002 elections were also characterised by dramatic turnout differences within the low turnout urban areas, with very low turnout levels in these contests in a number of Dublin working class areas, such as Ballyfermot/Cherry Orchard, North Clondalkin, West Tallaght, Ballymun and Darndale, as well as the Dublin inner-city area. Class-based turnout differences within Dublin narrowed quite dramatically across the next 15 years, however, with the narrowing of these turnout differences accelerating dramatically following on the onset of the economic crisis in 2008.
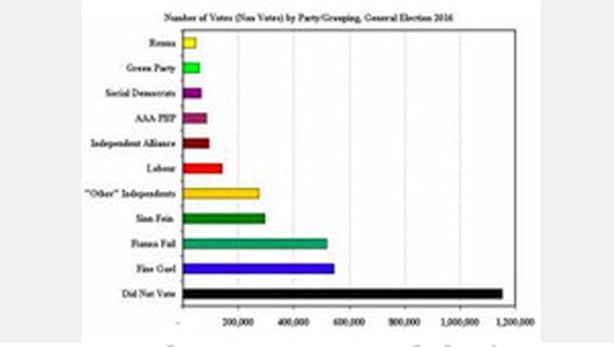
Turnout trends at the 2016 general election proved to be rather disappointing at a national level, especially given the improved turnout trends for the 2007 and 2011 contests, with turnout falling by almost five percent relative to turnout levels at the 2011 general election. Well over one million registered voters did not turn out to vote at this election – roughly twice as many as the number of people who voted for the largest political party at this election, Fine Gael (Figure 4).
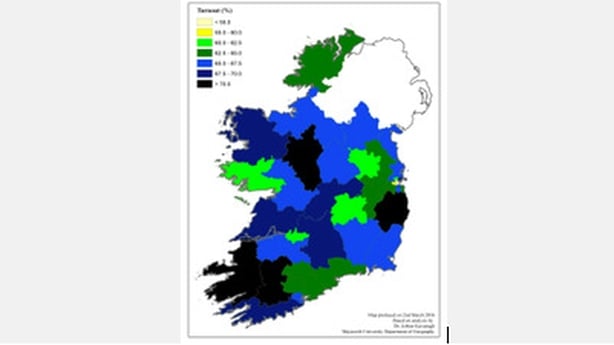
The large rural-urban variations in turnout levels that were associated with the low turnout in the 2002 contest were not as apparent in the 2007, 2011 and 2016 elections. As Figure 3 shows, the highest turnout constituencies again tended to be found in rural Ireland, but only four constituencies recorded turnout levels above the 70 percent level, namely Roscommon-Galway (71.6%), Wicklow (70.9%), Kerry (70.9%) and Wicklow (70.0%). By contrast, the lowest turnout levels were again associated with the three Dublin constituencies that take in parts of the Dublin Inner City – namely Dublin Central (52.4%), Dublin Bay South (54.8%) and Dublin South-Central (58.1%).
Going local: the picture in west Leinster
A detailed micro-geographical study of voter turnout in a number of constituencies at the 2016 general election, based on an analysis of the marked registers of electors for that election, has been carried out by the authors over the past year (and is still ongoing). This research allows for an electoral division level analysis of turnout at this election in the constituencies that have been focused on, to date. However, our research has been focusing on studying/mapping voter turnout trends for even smaller areas. This final section will outline some of the findings that have emerged from this small area analysis, to date.
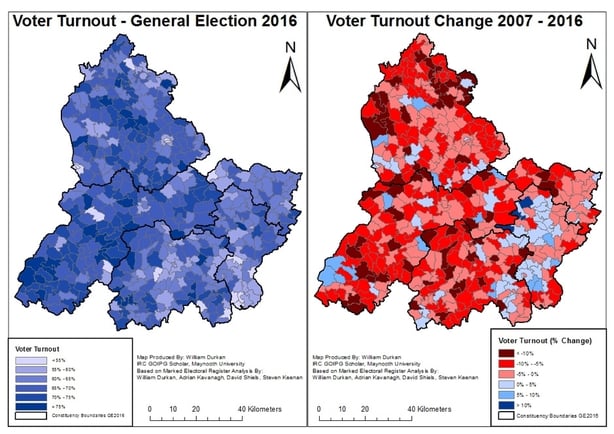
While rural-urban variations in voter turnout levels were still evident in the 2016 general election, there are signs that this trend was less pronounced than in previous elections, as noted earlier. Figure 5A outlines turnout levels in the study area chosen to examine this trend, consisting of the 2016 general election Dáil constituencies of Kildare North, Kildare South, Laois, Offaly and Longford-Westmeath.
Within this area, there is a notably higher turnout level in the more rural areas, with the lowest turnouts observed in urban centres. Voter turnout levels in the region ranged from a low of 49.3% in the Athlone West Urban ED (Westmeath) to a high of 85.0% in the Kilbarron ED (North Tipperary). This is consistent with traditional trends of higher general election turnout for the more rural areas. However, there are signs that this trend is beginning to change, as demonstrated in Figure 5B, which outlines areas of increase/decline between the 2007 and 2016 general election.
In order to examine the changing trends in urban/rural variation, the Teljeur urban/rural classification was applied to the region. This was originally created in order to examine urban/rural variations in healthcare services, but can also be useful when examining other social and political factors. This classification ranks areas into six categories, ranging from "City" to "Rural (Remote)" based on multiple data sources, including population density, settlement size and land-use. In this sense, the Teljeur classification offers more detail than a simple population density urban/rural classification.

The above table demonstrates the average voter turnout in general election 2016 and the average change in voter turnout in the period from 2007 to 2016 in each of the five Teljeur classes which are present in the study region. This hows that voter turnout remains at its highest in the more rural areas, but these more rural areas are also experiencing a greater rate of turnout decline. This suggests that the traditional urban-rural gap in voter turnout is narrowing, and this may have implications for citizens living in these areas.
Declining voter turnout levels in rural areas are a potential concern for citizens in these areas as it is a sign of decreasing political influence, which may impact on the political focus given to prevalent social issues in these communities. Declining rural turnout may also have significant impact on party support trends, as parties with large rural support bases may see a decline in the number of votes received from these areas, potentially influencing election results within constituencies with a notable urban-rural divide.
Going local: the picture in Dublin
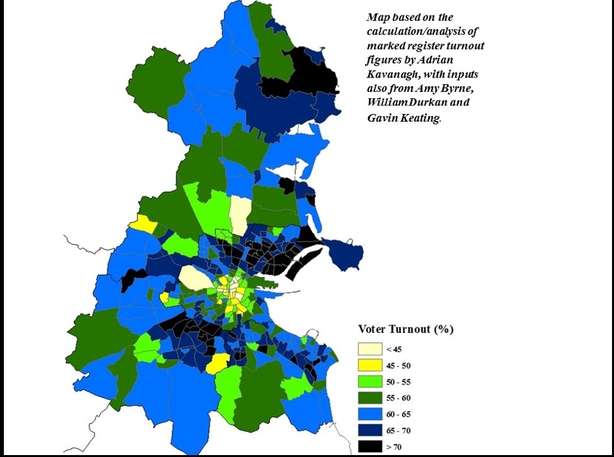
The map in Figure 6 is based on marked register-generated turnout figures for the 2016 general election and shows that there still remains very definite geographical pattern to the Dublin city turnout levels. This is almost akin to a doughnut effect, with very low turnout levels in Dublin inner city (and neighbouring areas), higher turnout on the edges of the Dublin city council area and then sometimes lower turnouts again in commuter belt areas in Fingal and South Dublin counties. The more working class areas, dominated by city or county council housing estates and flat complexes, also tended to have lower than average turnout levels for this contest, although there were relatively high turnout levels in some traditional working class areas, such as West Cabra.
However, the gap in turnout levels between middle class and working class areas in Dublin has narrowed considerably over the past decade and a half, but especially since the onset of the Economic Crisis in 2008. As Figure 7 shows, turnout levels have fallen in parts of Dublin since the 2007 election, but especially in the more middle class and rural areas, as well as the newer residential areas.
By contrast, turnouts increased between 2007 and 2016 in a number of working class areas in Dublin. These included North Clondalkin, West Tallaght, Cherry Orchard/Ballyfermot, Tyrellstown/Mulhuddart, Drimnagh/Crumlin, Finglas, Ballymun and Darndale, as well as parts of the Liberties and the North Inner City. This has translated into an influx of thousands of new/first time voters from these traditional working class areas, affording these areas a greater degree of political influence when it comes to electoral outcomes within their larger Dáil and local election constituencies. It can be no coincidence that the same period has seen stronger electoral performances for Sinn Féin, as well as a number of other left-wing parties/groupings such as People Before Profit, Solidarity and left-wing independents, as discussed in greater detail here.
As class becomes a less significant factor in terms of shaping and explaining turnout variations across the city, residential mobility is emerging as a particularly significant factor in terms of pointing towards/resulting in areas of lower voter turnout levels. Figure 6 shows low turnout levels in the Dublin Inner City, but also in other newer residential areas, such as the Greater Blanchardstown and South Lucan areas as well as the Northern Fringe.
Analysis carried out by one of the authors on the 1999 and 2002 elections in the South West Inner City (published in the Unequal Participation, Unequal Influence report) showed that the main low turnout areas were not, as might have been expected, the Dublin City Council flat complexes and housing estates. Instead, the very low turnout levels were associated mainly with the (then) new private gated apartments in that area.
Many of the areas with higher levels of residential mobility also tend to have higher levels of non-Irish/UK citizen residents, especially the Dublin Inner City area. While non Irish/UK citizen residents may have been on the electoral register for these areas, they would not have been eligible to vote in the general election as they only have the right to vote in local elections, or local and European elections in the case of other-EU citizens. However, turnouts in these areas remain low, even if the non-Irish/UK voters on the electoral register are not included in an analysis, as is the case with the maps used for this particular study.
Going local: the picture in Naas
While an electoral division level analysis of voter turnout offers a more detailed insight into the trends that drive voter participation, analysis at even smaller scales can also be beneficial. Analysis at a smaller scale offers the opportunity to examine trends, which may otherwise be hidden due to the aggregation of data at larger geographical scales.
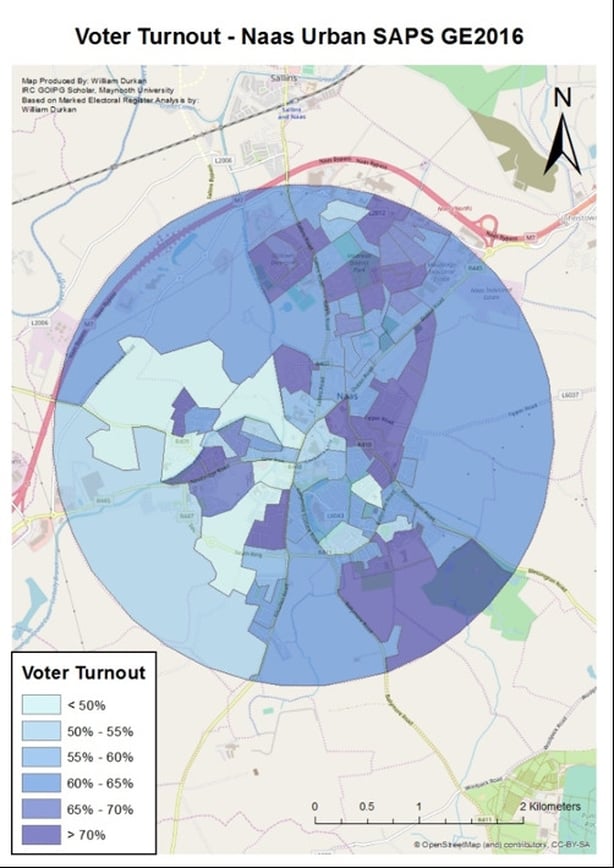
Figure 8 illustrates this. This displays voter turnout in the town of Naas, Co. Kildare in the 2016 general election. While the Naas Urban electoral division has an overall turnout of 62.4% - with turnout in all Kildare North electoral divisions ranging from a high of 70.3% in Kilteel ED to a low of 53.2% in Carrick ED - there is significant deviation among areas within the Naas Urban ED. Within the Naas Urban electoral division, small area analysis demonstrates a participation range between the lowest level (of 44.9%) and the highest level (of 79.7%).
"Voting is brisk"
The application of small area analysis to voter turnout trends serves to identify select areas of low/declining turnout, which are otherwise left unexamined with analysis at a larger scale. The prevalent socio-economic and demographic factors that serve to produce the observed trends are similar to that observed with analysis at the electoral division level, with housing tenure, employment and education levels seen to have the greatest impact on the resultant trends.
Areas of low voter turnout at any scale can be a cause for concern, as unequal voter turnout potentially leads to unequal political influence, and this is notably more pronounced among less well-to-do citizens. With this in mind, detailed analysis at multiple geographical scales can serve to identify vulnerable sections of the population who may have a low/declining level of political influence, and as such may be at a disadvantage when it comes to addressing social and political issues that directly impact on them, and their community.
Dr Adrian Kavanagh is a lecturer and Deputy Head of the Department of Geography at Maynooth University and President of the Geographical Society of Ireland. William Durkan is a Postgraduate Irish Research Council Government of Ireland researcher in the Geography Department of Maynooth University . William and Adrian, along with Caoilfhionn D’Arcy and Claire McGing, are founder members of Maynooth University’s Electoral Geography Group (EGG Maynooth), which recently hosted a one-day conference to mark the centenary of the pivotal 1918 election
The views expressed here are those of the author and do not represent or reflect the views of RTÉ